Note
Go to the end to download the full example code.
Sinogram (histogram) TOF Joseph Forward and Back Projection
This minimal example demonstrates how to call python API
for the sinogram (histogram) TOF Joseph forward and back projection functions, which are implemented in
parallelproj_core.joseph3d_tof_sino_fwd() and parallelproj_core.joseph3d_tof_sino_back().
Note
In this educational example, the TOF resolution is much smaller compared to the voxel size, which is not typical for real PET scanners, but better for visualization.
import importlib
import parallelproj_core
import matplotlib.pyplot as plt
from utils import show_voxel_cube, show_lors, to_numpy
import array API compatible library (CuPy if CUDA is available, otherwise NumPy).
if parallelproj_core.cuda_enabled == 1 and importlib.util.find_spec("cupy") is not None:
    import array_api_compat.cupy as xp

    dev = xp.cuda.Device(0)
else:
    import array_api_compat.numpy as xp

    dev = "cpu"
Print backend and device info.
print(f"parallelproj_core version: {parallelproj_core.__version__}")
print(f"parallelproj_core cuda enabled: {parallelproj_core.cuda_enabled}")
print(f"using array API compatible library: {xp.__name__} on device {dev}")
parallelproj_core version: v2.0.1
parallelproj_core cuda enabled: 0
using array API compatible library: array_api_compat.numpy on device cpu
Define a mini sparse demo image.
image = xp.zeros((5, 5, 5), dtype=xp.float32, device=dev)
image[0, 2, 4] = 0.25
image[4, 2, 4] = 0.25
image[0, 0, 0] = 0.5
image[4, 4, 4] = 0.5

voxel_size = xp.asarray([2.0, 2.0, 2.0], device=dev, dtype=xp.float32)
img_origin = xp.asarray([-1.0, -1.0, -1.0], device=dev, dtype=xp.float32)
Define LOR start and end points.
lor_start = xp.asarray(
    [[14.0, 3.5, 7.0], [-1, -1, -8], [7, -6, -6]],
    device=dev,
    dtype=xp.float32,
)
lor_end = xp.asarray(
    [[-8.0, 3.5, 7.0], [-1, -1, 14], [7, 12, 12]],
    device=dev,
    dtype=xp.float32,
)
TOF parameter setup
# standard deviation of the TOF kernel in spatial units (mm)
sigma_tof = xp.asarray([2.0], device=dev, dtype=xp.float32)
# width of the TOF sinogram bins in mm
tofbin_width = float(sigma_tof[0]) / 2.0
# offset of the TOF center in mm
tof_center_offset = xp.asarray([0.0], device=dev, dtype=xp.float32)
# number of sigmas for truncation of Gaussian TOF kernel
num_sigmas = 3.0
# number of TOF bins needed to cover an LOR of 20mm length
num_tofbins = int(20 / tofbin_width) + 1
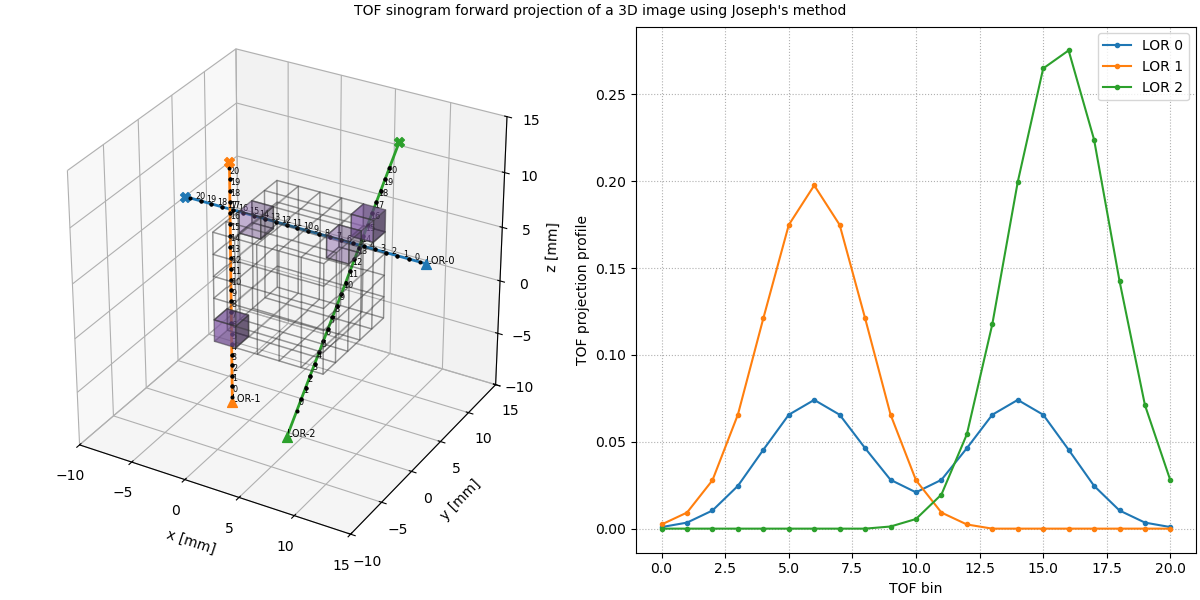
Forward projection of the demo image.
img_fwd = xp.zeros((lor_start.shape[0], num_tofbins), dtype=xp.float32, device=dev)
parallelproj_core.joseph3d_tof_sino_fwd(
    lor_start,
    lor_end,
    image,
    img_origin,
    voxel_size,
    img_fwd,
    tofbin_width,
    sigma_tof,
    tof_center_offset,
    num_tofbins,
    num_sigmas,
)
print(img_fwd)
[[0.00090206 0.00347077 0.01045007 0.0246249  0.04541901 0.06557555
  0.07411528 0.06557555 0.04632107 0.02809567 0.02090013 0.02809567
  0.04632107 0.06557555 0.07411528 0.06557555 0.04541901 0.0246249
  0.01045007 0.00347077 0.00090206]
 [0.0024055  0.00925539 0.02786685 0.06566641 0.12111737 0.17486815
  0.19764075 0.17486815 0.12111737 0.06566641 0.02786685 0.00925539
  0.0024055  0.         0.         0.         0.         0.
  0.         0.         0.        ]
 [0.         0.         0.         0.         0.         0.
  0.         0.         0.         0.00122766 0.00554934 0.0196281
  0.05433032 0.11770228 0.19959447 0.26494858 0.2753215  0.22396815
  0.14262262 0.07109211 0.02773627]]
fig = plt.figure(figsize=(12, 6), layout="constrained")
ax = fig.add_subplot(121, projection="3d")
show_voxel_cube(ax, image, voxel_size, img_origin)
show_lors(
    ax,
    lor_start,
    lor_end,
    labels=[f"LOR-{i}" for i in range(lor_start.shape[0])],
    num_tofbins=num_tofbins,
    tofbin_width=tofbin_width,
    tof_center_offset=tof_center_offset,
)

ax.set_xlim(-10, 15)
ax.set_ylim(-10, 15)
ax.set_zlim(-10, 15)
ax.set_xlabel("x [mm]")
ax.set_ylabel("y [mm]")
ax.set_zlabel("z [mm]")
ax.set_box_aspect([1, 1, 1])
fig.suptitle(
    "TOF sinogram forward projection of a 3D image using Joseph's method",
    fontsize="medium",
)

ax_b = fig.add_subplot(122)

for i in range(img_fwd.shape[0]):
    ax_b.plot(to_numpy(img_fwd[i, ...]), ".-", label=f"LOR {i}")

ax_b.set_xlabel("TOF bin")
ax_b.set_ylabel("TOF projection profile")
ax_b.grid(ls=":")
ax_b.legend()

fig.show()
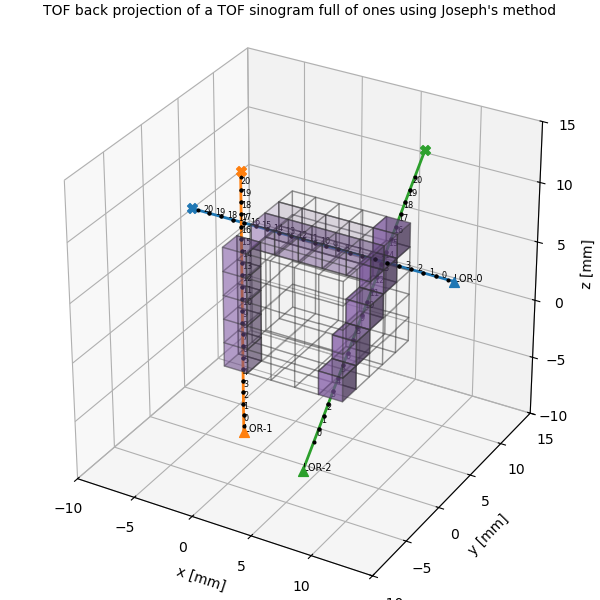
TOF back projection of a TOF sinogram full of ones.
back_ones = xp.zeros(image.shape, dtype=xp.float32, device=dev)
parallelproj_core.joseph3d_tof_sino_back(
    lor_start,
    lor_end,
    back_ones,
    img_origin,
    voxel_size,
    xp.ones(img_fwd.shape, dtype=xp.float32, device=dev),
    tofbin_width,
    sigma_tof,
    tof_center_offset,
    num_tofbins,
    num_sigmas,
)
fig2 = plt.figure(figsize=(6, 6), layout="constrained")
ax2 = fig2.add_subplot(111, projection="3d")
show_voxel_cube(ax2, back_ones, voxel_size, img_origin)
show_lors(
    ax2,
    lor_start,
    lor_end,
    labels=[f"LOR-{i}" for i in range(lor_start.shape[0])],
    num_tofbins=num_tofbins,
    tofbin_width=tofbin_width,
    tof_center_offset=tof_center_offset,
)

ax2.set_xlim(-10, 15)
ax2.set_ylim(-10, 15)
ax2.set_zlim(-10, 15)
ax2.set_xlabel("x [mm]")
ax2.set_ylabel("y [mm]")
ax2.set_zlabel("z [mm]")
ax2.set_box_aspect([1, 1, 1])
ax2.set_title(
    "TOF back projection of a TOF sinogram full of ones using Joseph's method",
    fontsize="medium",
)

fig2.show()
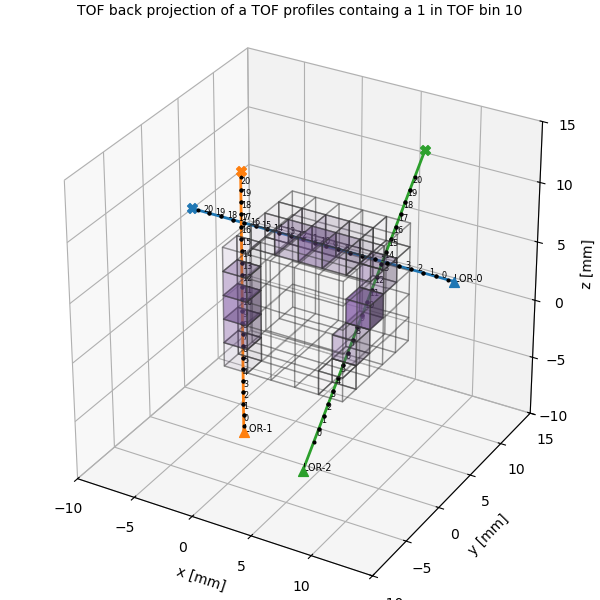
TOF back projection of a TOF sinogram containing a 1 in the “central” TOF bin.
center_tofbin = num_tofbins // 2
tof_sino = xp.zeros(img_fwd.shape, dtype=xp.float32, device=dev)
tof_sino[:, center_tofbin] = 1.0

img_back = xp.zeros(image.shape, dtype=xp.float32, device=dev)
parallelproj_core.joseph3d_tof_sino_back(
    lor_start,
    lor_end,
    img_back,
    img_origin,
    voxel_size,
    tof_sino,
    tofbin_width,
    sigma_tof,
    tof_center_offset,
    num_tofbins,
    num_sigmas,
)
fig3 = plt.figure(figsize=(6, 6), layout="constrained")
ax3 = fig3.add_subplot(111, projection="3d")
show_voxel_cube(ax3, img_back, voxel_size, img_origin)
show_lors(
    ax3,
    lor_start,
    lor_end,
    labels=[f"LOR-{i}" for i in range(lor_start.shape[0])],
    num_tofbins=num_tofbins,
    tofbin_width=tofbin_width,
    tof_center_offset=tof_center_offset,
)

ax3.set_xlim(-10, 15)
ax3.set_ylim(-10, 15)
ax3.set_zlim(-10, 15)
ax3.set_xlabel("x [mm]")
ax3.set_ylabel("y [mm]")
ax3.set_zlabel("z [mm]")
ax3.set_box_aspect([1, 1, 1])
ax3.set_title(
    f"TOF back projection of a TOF profiles containg a 1 in TOF bin {center_tofbin}",
    fontsize="medium",
)

fig3.show()
Total running time of the script: (0 minutes 2.377 seconds)